freud.density.RDF: Accumulating g(r) for a Fluid
The freud.density module is intended to compute a variety of quantities that relate spatial distributions of particles with other particles. This example demonstrates the calculation of the radial distribution function \(g(r)\) for a fluid, averaged over multiple frames.
[1]:
import freud
import matplotlib.pyplot as plt
import numpy as np

data_path = "data/phi065"
box_data = np.load(f"{data_path}/box_data.npy")
pos_data = np.load(f"{data_path}/pos_data.npy")


def plot_rdf(box_arr, points_arr, prop, r_max=10, bins=100, label=None, ax=None):
    """Helper function for plotting RDFs."""
    if ax is None:
        fig, ax = plt.subplots(1, 1, figsize=(12, 8))
        ax.set_title(prop, fontsize=16)
    rdf = freud.density.RDF(bins, r_max)
    for box, points in zip(box_arr, points_arr):
        rdf.compute(system=(box, points), reset=False)
    if label is not None:
        ax.plot(rdf.bin_centers, getattr(rdf, prop), label=label)
        ax.legend()
    else:
        ax.plot(rdf.bin_centers, getattr(rdf, prop))
    return ax
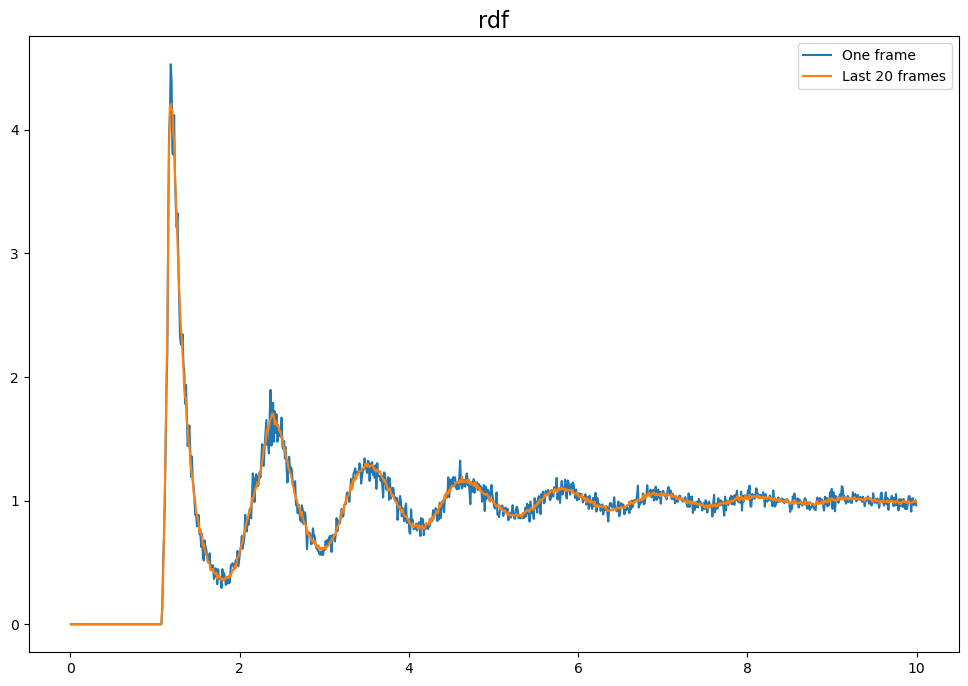
Here, we show the difference between the RDF of one frame and an accumulated (averaged) RDF from several frames. Including more frames makes the plot smoother.
[2]:
# Compute the RDF for the last frame
box_arr = [box_data[-1].tolist()]
pos_arr = [pos_data[-1]]
ax = plot_rdf(box_arr, pos_arr, "rdf", label="One frame")

# Compute the RDF for the last 20 frames
box_arr = [box.tolist() for box in box_data[-20:]]
pos_arr = pos_data[-20:]
ax = plot_rdf(box_arr, pos_arr, "rdf", label="Last 20 frames", ax=ax)

plt.show()
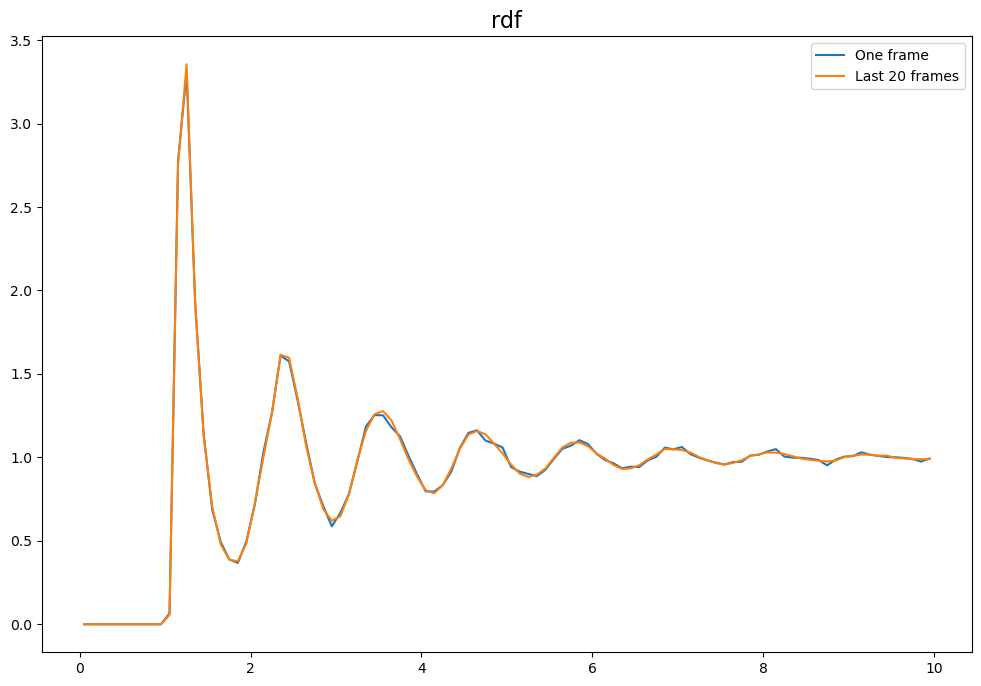
The difference between calling compute on a series of frames and calling compute on a single frame is more striking for smaller bin sizes, which are statistically noisier.
[3]:
# Compute the RDF for the last frame
box_arr = [box_data[-1].tolist()]
pos_arr = [pos_data[-1]]
ax = plot_rdf(box_arr, pos_arr, "rdf", bins=1000, label="One frame")

# Compute the RDF for the last 20 frames
box_arr = [box.tolist() for box in box_data[-20:]]
pos_arr = pos_data[-20:]
ax = plot_rdf(box_arr, pos_arr, "rdf", bins=1000, label="Last 20 frames", ax=ax)

plt.show()