Visualizing 3D Voronoi and Voxelization#
The plato-draw package allows for visualizing particle data in 2D and 3D using a variety of backend libraries. Here, we show a 3D Voronoi diagram drawn using fresnel and pythreejs. We use rowan to generate the view rotation.
To install dependencies:
conda install -c conda-forge fresnelpip install plato-draw rowan
[1]:
import freud
import matplotlib.cm
import numpy as np
import plato.draw.fresnel
import rowan

backend = plato.draw.fresnel
# For interactive scenes:
# import plato.draw.pythreejs
# backend = plato.draw.pythreejs
[2]:
def plot_crystal(
    box,
    positions,
    colors=None,
    radii=None,
    backend=None,
    polytopes=[],
    polytope_colors=None,
):
    if backend is None:
        backend = plato.draw.fresnel
    if colors is None:
        colors = np.array([[0.5, 0.5, 0.5, 1]] * len(positions))
    if radii is None:
        radii = np.array([0.5] * len(positions))
    sphere_prim = backend.Spheres(positions=positions, colors=colors, radii=radii)
    box_prim = backend.Box.from_box(box, width=0.1)
    if polytope_colors is None:
        polytope_colors = colors * np.array([1, 1, 1, 0.4])
    polytope_prims = []
    for p, c in zip(polytopes, polytope_colors):
        p_prim = backend.ConvexPolyhedra(
            positions=[[0, 0, 0]], colors=c, vertices=p, outline=0
        )
        polytope_prims.append(p_prim)
    rotation = rowan.multiply(
        rowan.from_axis_angle([1, 0, 0], np.pi / 10),
        rowan.from_axis_angle([0, 1, 0], -np.pi / 10),
    )
    scene = backend.Scene(
        [sphere_prim, box_prim, *polytope_prims], zoom=3, rotation=rotation
    )
    if backend is not plato.draw.fresnel:
        scene.enable("directional_light")
    else:
        scene.enable("antialiasing")
    scene.show()
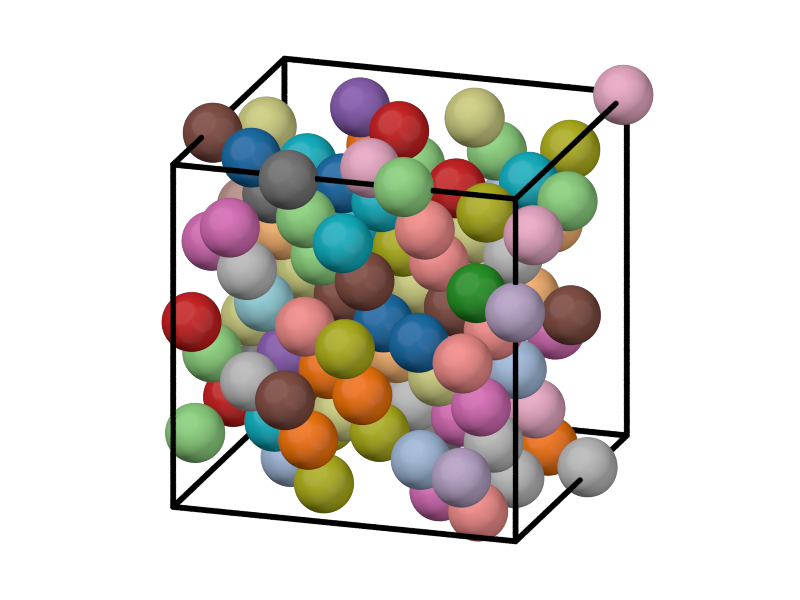
We generate an fcc structure and add Gaussian noise to the positions. Colors are assigned randomly.
[3]:
np.random.seed(12)
box, positions = freud.data.UnitCell.fcc().generate_system(3, scale=2, sigma_noise=0.05)
cmap = matplotlib.cm.get_cmap("tab20")
colors = cmap(np.random.rand(len(positions)))
[4]:
plot_crystal(box, positions, colors, backend=backend)

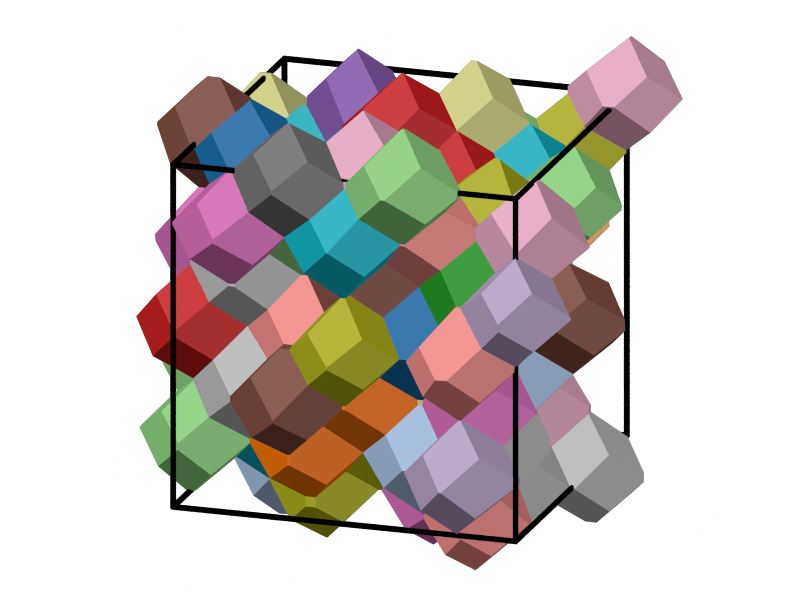
We make a Voronoi tesselation of the system and plot it in 3D. The Voronoi cells are approximately rhombic dodecahedra, which tesselate 3D space in a face-centered cubic lattice.
[5]:
voro = freud.locality.Voronoi()
voro.compute(system=(box, positions))
plot_crystal(box, positions, colors=colors, backend=backend, polytopes=voro.polytopes)

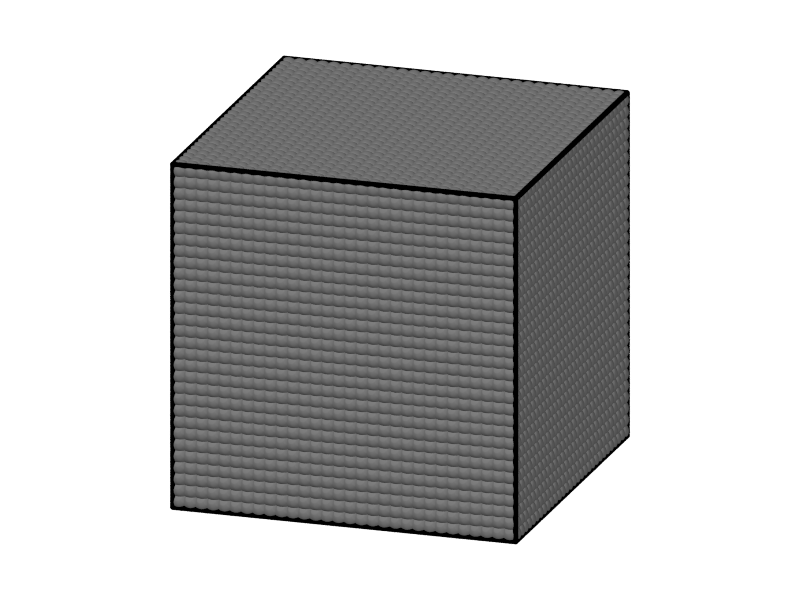
We generate a voxelization of this space by creating a dense lattice of points on a simple cubic lattice.
[6]:
def make_cubic_grid(box, voxels_per_side):
    v_space = np.linspace(0, 1, voxels_per_side + 1)
    v_space = (v_space[:-1] + v_space[1:]) / 2  # gets centers of the voxels
    return np.array(
        [
            box.make_absolute([x, y, z])
            for x in v_space
            for y in v_space
            for z in v_space
        ]
    )
[7]:
voxels_per_side = 30
cubic_grid = make_cubic_grid(box, voxels_per_side)

# Make the spheres overlap just a bit
radii = np.ones(len(cubic_grid)) * 0.8 * np.max(box.L) / voxels_per_side

plot_crystal(box, cubic_grid, radii=radii, backend=backend)

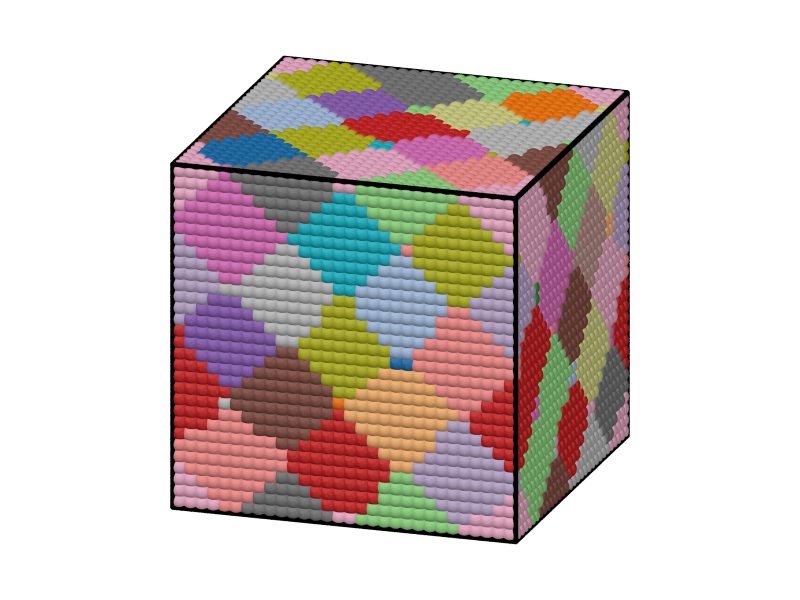
We color the voxels by their first nearest neighbor. This is mathematically equivalent to being inside the corresponding Voronoi cell. Here, we get the neighbor indices (this can be used to separate the Voronoi cells into voxels).
[8]:
aq = freud.AABBQuery(box, positions)
voxel_neighbors = -np.ones(len(cubic_grid), dtype=np.int32)
for i, j, distance in aq.query(cubic_grid, {"num_neighbors": 1}):
    voxel_neighbors[i] = j
Next, we use these indices to color and draw the voxelization.
[9]:
voxel_colors = np.array([colors[i] for i in voxel_neighbors])
plot_crystal(box, cubic_grid, colors=voxel_colors, radii=radii, backend=backend)
